DevOps for Small Teams: A Practical Guide Without a Platform Team
A practical DevOps playbook for teams of 1-5 engineers covering minimum viable CI/CD, monitoring, infrastructure as code, security, and incident response without dedicated platform engineers.
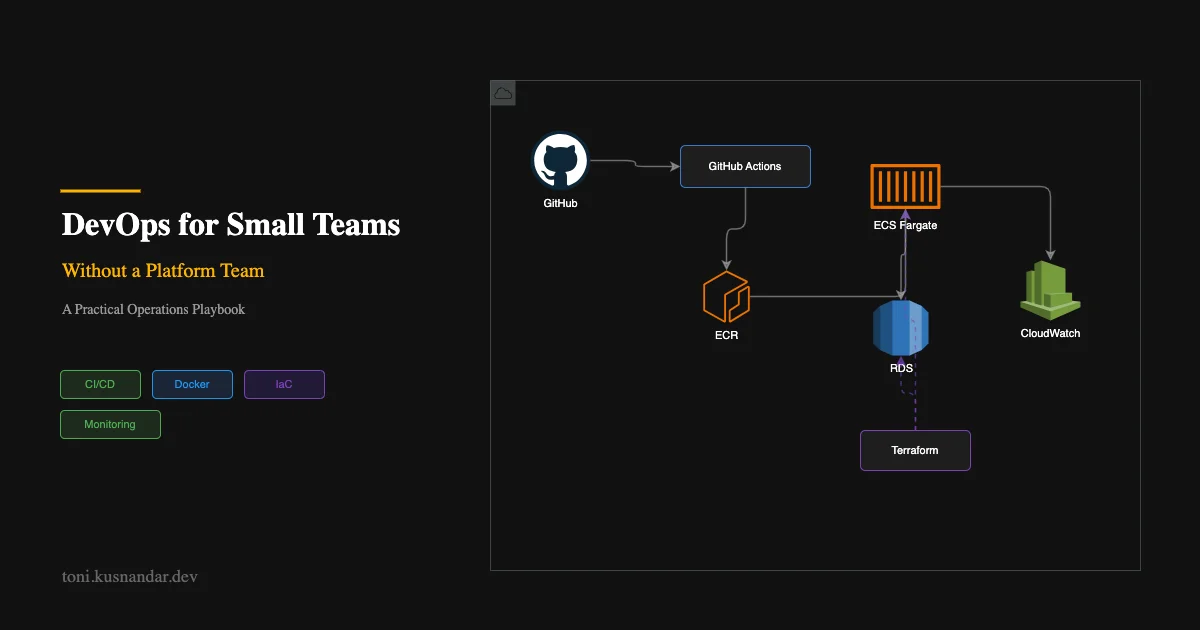
Let me tell you a story I have lived multiple times. You join a small team. Everyone is excited about the product. Nobody wants to deal with infrastructure. Deployments happen manually via SSH. Monitoring is “someone checks the app every few hours.” The staging environment is someone’s laptop.
Sound familiar? I have helped dozens of small teams move from this chaos to a functioning DevOps practice without hiring a platform team. The key is knowing what to invest in early and what to ignore until later.
This guide is for teams of 1-5 engineers who need reliable deployments, basic monitoring, and infrastructure they can understand. Not enterprise-grade, battle-tested-at-Netflix operations. Practical operations that let you ship product confidently.
The Reality of Being the Solo Ops Person
In a small team, someone ends up being “the DevOps person” by default. Usually the most senior engineer or whoever set up the first server. This creates problems:
- That person becomes a bottleneck for all infrastructure changes
- They spend 30%+ of their time on ops instead of product
- Knowledge is concentrated in one head (bus factor of 1)
- When they leave, nobody knows how anything works
The goal of this guide is to make DevOps a team capability, not a person. Document everything, automate everything possible, and keep it simple enough that any developer on the team can handle it.
Minimum Viable DevOps Stack
Here is what I set up on day 1 for every new project. Total setup time: 1 day. Monthly cost: under $100 for tooling:

| Layer | Tool | Cost | Setup Time |
|---|---|---|---|
| Source control | GitHub | Free | 0 (already done) |
| CI/CD | GitHub Actions | Free (2000 min/month) | 2 hours |
| Container registry | AWS ECR | ~$1/month | 30 minutes |
| Runtime | ECS Fargate | Based on usage | 2 hours |
| Infrastructure | Terraform | Free | 2 hours |
| Monitoring | CloudWatch + Grafana Cloud | Free tier | 1 hour |
| Alerting | PagerDuty/Opsgenie free tier | Free | 30 minutes |
| Security scanning | GitHub Dependabot + ECR scanning | Free | 15 minutes |
That is it. No Kubernetes. No service mesh. No custom monitoring stack. These are the tools that give you 80% of the value with 20% of the complexity.
CI/CD: Keep It Simple
Your CI/CD pipeline has one job: get tested code from your main branch to production safely and automatically. Here is the pattern I use for every project, build, test, push to ECR, deploy to ECS:
The Two-Pipeline Pattern
Pipeline 1: Pull Request (runs on every PR)
name: PR Check
on: [pull_request]

jobs:
  check:
    runs-on: ubuntu-latest
    steps:
      - uses: actions/checkout@v4
      - name: Run tests
        run: make test
      - name: Run linter
        run: make lint
      - name: Build (verify it compiles)
        run: make build
Pipeline 2: Deploy (runs on merge to main)
name: Deploy
on:
  push:
    branches: [main]

jobs:
  deploy:
    runs-on: ubuntu-latest
    steps:
      - uses: actions/checkout@v4
      - name: Run tests
        run: make test
      - name: Build and push Docker image
        run: make docker-push
      - name: Deploy to ECS
        run: make deploy
That is it. Two files, clear responsibilities. PR pipeline gives fast feedback. Deploy pipeline handles production.
What I Do Not Do in CI/CD
- No complex branching strategies. main branch is always deployable. Feature branches merge via PR.
- No manual approval gates (for staging). Save approval gates for production only.
- No environment-specific builds. Same image, different config via environment variables.
- No custom runners. GitHub-hosted runners are fast enough for 95% of workloads.
Containerization Strategy
Development: Docker Compose
Every developer runs the full stack locally with one command:
# docker-compose.yml
services:
  api:
    build: .
    ports:
      - "8080:8080"
    environment:
      - DATABASE_URL=postgres://postgres:postgres@db:5432/myapp
      - REDIS_URL=redis://redis:6379
    depends_on:
      - db
      - redis

  db:
    image: postgres:16-alpine
    environment:
      POSTGRES_DB: myapp
      POSTGRES_PASSWORD: postgres
    ports:
      - "5432:5432"
    volumes:
      - pgdata:/var/lib/postgresql/data

  redis:
    image: redis:7-alpine
    ports:
      - "6379:6379"

volumes:
  pgdata:
docker compose up and you are developing. No “works on my machine” problems.
Production: ECS Fargate
I have written extensively about why Fargate over Kubernetes for small teams. The short version: Fargate gives you containers without cluster management. Push image, define resources, run.
The production setup from my AWS architecture patterns guide:
resource "aws_ecs_service" "api" {
  name            = "api"
  cluster         = aws_ecs_cluster.main.id
  task_definition = aws_ecs_task_definition.api.arn
  desired_count   = 2
  launch_type     = "FARGATE"

  deployment_circuit_breaker {
    enable   = true
    rollback = true
  }
}
Two tasks for availability. Circuit breaker for automatic rollback. That is your production-ready container setup.
Monitoring: The 3 Metrics That Actually Matter
Stop trying to monitor everything. Start with these three:
1. Request Latency (P95)
What to track: the 95th percentile response time of your API.
Why: this tells you how your slowest (but not outlier) users experience your service. If P95 is 500ms, 5% of your users wait over half a second.
Alert threshold: when P95 exceeds 2x your baseline for 5 minutes.
2. Error Rate (5xx percentage)
What to track: percentage of requests returning 500-level errors.
Why: this directly measures user impact. A 1% error rate means 1 in 100 requests fails.
Alert threshold: when error rate exceeds 1% for 3 minutes.
3. Resource Utilization (CPU and Memory)
What to track: CPU and memory usage of your containers.
Why: this predicts capacity issues before they become user-facing problems.
Alert threshold: when either exceeds 80% for 10 minutes.
Setting Up Basic Monitoring
For ECS Fargate, CloudWatch gives you CPU and memory for free. For application metrics, add a simple middleware:
func metricsMiddleware(next http.Handler) http.Handler {
    return http.HandlerFunc(func(w http.ResponseWriter, r *http.Request) {
        start := time.Now()
        ww := middleware.NewWrapResponseWriter(w, r.ProtoMajor)

        next.ServeHTTP(ww, r)

        duration := time.Since(start)
        status := ww.Status()

        // Emit to CloudWatch or Prometheus
        recordRequestMetric(r.Method, r.URL.Path, status, duration)
    })
}
Alerting: Useful Alerts vs Alert Fatigue
The rule: if an alert does not require immediate human action, it is not an alert.
Alerts (wake someone up):
- Error rate above 5% for 5 minutes
- Service completely unreachable
- Database connection pool exhausted
- Disk space below 10%
Notifications (check next business day):
- Error rate between 1-5%
- P95 latency degraded but functional
- CPU consistently above 70%
- SSL certificate expiring in 14 days
Send alerts to PagerDuty/Opsgenie with phone escalation. Send notifications to a Slack channel that someone checks daily. Never mix these channels.
Infrastructure as Code: Terraform Covering 80%
Even if your entire infrastructure is “one Fargate service and a database,” put it in Terraform. Reasons:
- Reproducibility. Can you recreate your production environment from scratch? With Terraform: yes, in 10 minutes.
- Documentation. Your infrastructure is documented as code. New team members read it and understand what exists.
- Auditability. Git history shows who changed what infrastructure and when.
Minimum Terraform Structure
terraform/
├── main.tf          # Provider config, backend
├── vpc.tf           # Network (VPC, subnets, NAT)
├── ecs.tf           # Cluster, services, task definitions
├── rds.tf           # Database
├── variables.tf     # Input variables
├── outputs.tf       # Output values
└── terraform.tfvars # Environment-specific values
Start here. Do not create modules until you have at least 2 environments that share the same resources. Premature modularization adds complexity without benefit.
Security: Automated Without Slowing Velocity
Security for small teams means automated scanning that runs without human intervention:
1. Dependency Scanning (Dependabot)
Enable GitHub Dependabot. It automatically creates PRs for vulnerable dependencies. Review and merge weekly.
2. Container Scanning (ECR)
resource "aws_ecr_repository" "api" {
  name = "my-api"

  image_scanning_configuration {
    scan_on_push = true
  }
}
Every image push triggers a vulnerability scan. Review findings in the ECR console.
3. IAM Least Privilege
Never use admin access. Create specific roles for specific tasks:
# Application role - only what the app actually needs
resource "aws_iam_role_policy" "app" {
  role = aws_iam_role.ecs_task.id
  policy = jsonencode({
    Statement = [
      {
        Effect   = "Allow"
        Action   = ["s3:GetObject", "s3:PutObject"]
        Resource = "${aws_s3_bucket.uploads.arn}/*"
      },
      {
        Effect   = "Allow"
        Action   = ["sqs:SendMessage"]
        Resource = aws_sqs_queue.notifications.arn
      }
    ]
  })
}
4. Secrets Management
Never put secrets in code, environment files, or Terraform state:
# Store in SSM Parameter Store
resource "aws_ssm_parameter" "db_password" {
  name  = "/myapp/production/db_password"
  type  = "SecureString"
  value = var.db_password  # Passed via CI/CD, never in tfvars
}
Incident Response: When Things Break at 3 AM
Small teams cannot afford complex runbooks. But you need a plan:
The 3-Step Incident Process
Step 1: Assess (2 minutes)
- Is the service completely down or degraded?
- How many users are affected?
- When did it start?
Step 2: Mitigate (5-15 minutes)
- Can you rollback the last deployment?
- Can you scale up to handle load?
- Can you fail over to a backup?
Step 3: Fix (after mitigation)
- Root cause analysis
- Permanent fix
- Update monitoring to catch it earlier next time
Rollback Script
Every team member should know how to rollback:
#!/bin/bash
# rollback.sh - revert to previous ECS task definition

CLUSTER="my-cluster"
SERVICE="my-api-service"

# Get current task definition
CURRENT=$(aws ecs describe-services --cluster $CLUSTER --services $SERVICE \
  --query 'services[0].taskDefinition' --output text)

# Get previous revision number
CURRENT_REV=$(echo $CURRENT | grep -oP ':\K\d+')
PREV_REV=$((CURRENT_REV - 1))
FAMILY=$(echo $CURRENT | sed "s/:${CURRENT_REV}/:${PREV_REV}/")

echo "Rolling back from revision $CURRENT_REV to $PREV_REV"
aws ecs update-service --cluster $CLUSTER --service $SERVICE \
  --task-definition $FAMILY --force-new-deployment

echo "Waiting for service stability..."
aws ecs wait services-stable --cluster $CLUSTER --services $SERVICE
echo "Rollback complete"
When to Evolve: Signals You Need More
Your minimum viable DevOps stack will not last forever. Here are the signals it is time to invest more:
| Signal | What It Means | What to Add |
|---|---|---|
| Deploys take > 15 min | Pipeline needs optimization | Parallel builds, caching |
| > 5 services | Shared infra getting complex | Terraform modules |
| Multiple environments | Manual env management | Workspace or directory separation |
| Compliance requirements | Need audit trails | Centralized logging, access reviews |
| Team > 5 people | Coordination overhead | Feature flags, canary deploys |
| Incidents weekly | Monitoring gaps | Distributed tracing, better alerting |
The ROI Conversation
When your manager asks “why are we spending time on DevOps instead of features?”:
Frame it as risk reduction:
- “Without CI/CD, every deploy is a manual process that can fail differently each time.”
- “Without monitoring, we find out about outages when customers complain.”
- “Without IaC, recreating our environment takes days instead of minutes.”
Frame it as velocity:
- “Automated deploys let us ship 5x more frequently with less risk.”
- “Good monitoring means we fix issues in minutes, not hours.”
- “Developers spend less time on environment issues and more time on features.”
Frame it with numbers:
- Manual deploy: 30 minutes each, 3x/week = 6 hours/month
- Incident without monitoring: average 2 hours to detect + fix
- Environment recreation without IaC: 1-2 days of an engineer’s time
Wrapping Up
DevOps for small teams is about making pragmatic choices. You do not need everything Netflix or Google uses. You need:
- Automated deployments that work every time
- Monitoring that tells you when things break
- Infrastructure you can recreate from code
- Security that runs on autopilot
Set this up in your first week. Then stop thinking about it and build product. Revisit quarterly to see if your needs have outgrown your tools.
If you need help setting up or optimizing your DevOps practice, I offer DevOps support for small teams. We focus on practical automation that gives you time back for product development.
You can also see examples of these patterns applied in real projects on my DevOps portfolio and CI/CD implementations.
If you are just starting out with DevOps and want the full journey from zero, from understanding what a server actually is, through VPS deployments, Docker, and CI/CD, the Learning DevOps From Zero series walks through each stage with the reasoning behind every tool, not just the how-to.